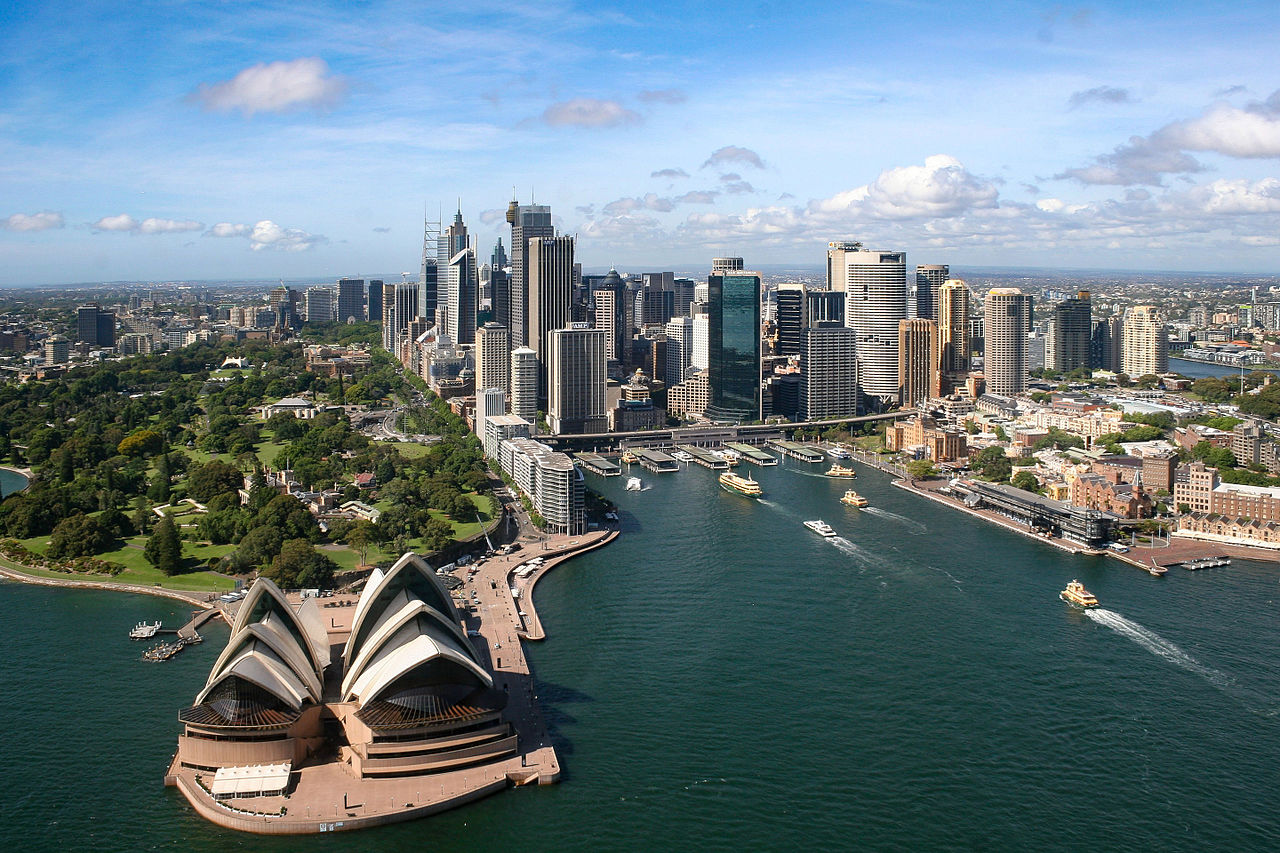
Sydney is one of the world’s great global cities. It’s over five million residents enjoy a stunning environment, vibrant culture, and lifestyle and an economy which represents nearly 25 per cent of Australia’s gross domestic product. However, housing continues to be a massive burden with the median price at $1.2 Million for a house according to CoreLogic & families struggling to pay rent.
Just like everything else, change and transformation are constant. The urban landscape of Sydney is not left out of the natural environment has been changing for years. Indigenous land management over the past years has undoubtedly also contributed to the change in its landscape. Ongoing land-clearing for urban development in different areas is leading to a significant loss of biodiversity. For example, the Central Coast and new suburban developments in western Sydney are instances where important biological areas being lost to urban expansion.
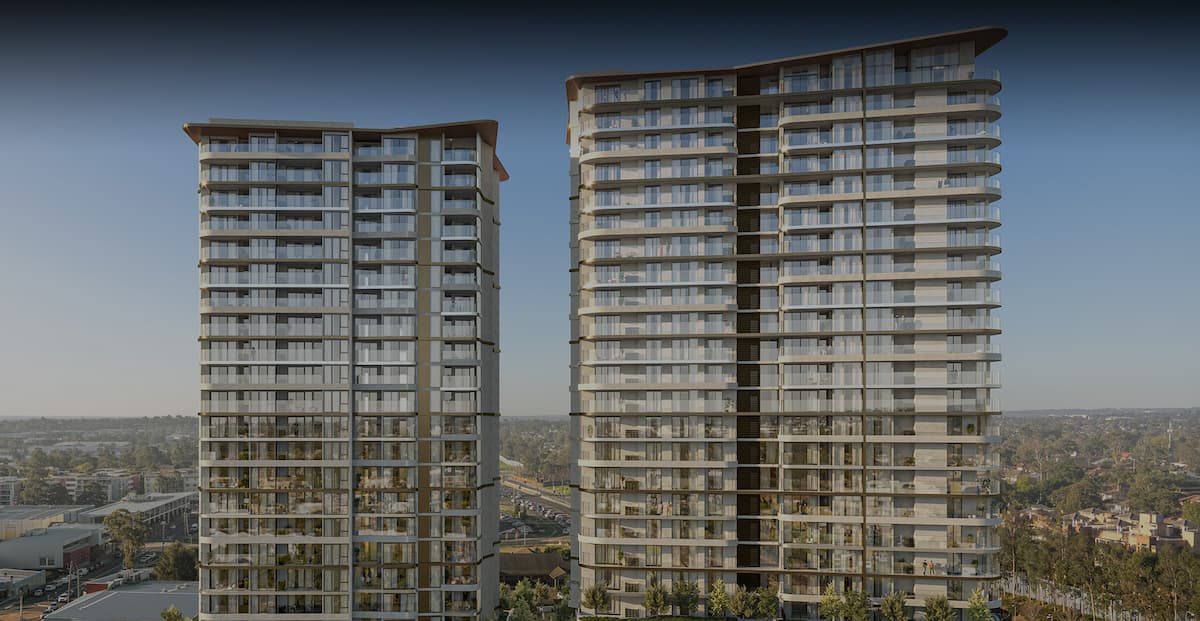
Over the past years, there was an insufficient provision of housing and the infrastructure needed to meet the growth challenges in Sydney, but in the past two decades, housing development has grown considerably which has resulted in successfully changing the urban landscape and in the process causing significant transport problems across the metropolitan area.
Sydney, over the past 20 years, has experienced about 484,189 dwelling unit completions and also a significant change in population over the same period of time, however, the upcoming 5 years will see a huge influx of around 180,000 new dwellings in Sydney which is almost double the average for a 5 year period over the past 20 years.
The table below shows the varying figures of how developments were carried out and the population changes over the past 2 decades.
Number of Dwellings Completed In Syndey by Year
| Year | No. of dwellings completed |
| 1997 | 22,225 |
| 1998 | 22,639 |
| 1999 | 27,489 |
| 2000 | 30,609 |
| 2001 | 29,051 |
| 2002 | 27,723 |
| 2003 | 22,473 |
| 2004 | 22,584 |
| 2005 | 19,542 |
| 2006 | 17,613 |
| 2007 | 14,715 |
| 2008 | 13,862 |
| 2009 | 13,041 |
| 2010 | 13,293 |
| 2011 | 14,722 |
| 2012 | 15,104 |
| 2013 | 20,339 |
| 2014 | 22,750 |
| 2015 | 27,348 |
| 2016 | 30,191 |
| 2017 | 37,575 |
Source: ABS
Change in Sydney’s Population by Year
| Year | Population change Within Sydney |
| 1997 | 42,739 |
| 1998 | 36,631 |
| 1999 | 44,872 |
| 2000 | 43,513 |
| 2001 | 27,834 |
| 2002 | 30,123 |
| 2003 | 25,167 |
| 2004 | 21,490 |
| 2005 | 31,396 |
| 2006 | 36,950 |
| 2007 | 65,916 |
| 2008 | 78,198 |
| 2009 | 78,360 |
| 2010 | 59,571 |
| 2011 | 51,137 |
| 2012 | 64,408 |
| 2013 | 76,365 |
| 2014 | 79,794 |
| 2015 | 82,403 |
| 2016 | 81,231 |
| 2017 | TBA |
Source: ABS
With the significant change seen in the population, it was discovered over 16 million trips were made each weekday and cars account for about 88% of this trips. This causes congestion on some of Sydney’s major arterial roads thereby posing problems to bus operators, drivers, and freight vehicles not only by automobiles but also the parking lots they make use of.
In March 2006, it was discovered, 70% of adults in Sydney went to work or study by their privately owned automobiles, compared to 23% that used public transport and 7% that walked or cycled.
It is believed based on the data gathered, that western Sydney is the most developed. According to CoreLogic data, it was revealed that of the 10 development-heavy suburbs featuring the strongest out of area interest in the last 12 months, the top four are from Western Sydney and two more make the list.
The Ponds in the Blacktown LGA top the log with 46.8 per cent of current residents revealing they had lived at a different address 1 year ago. Next, it is Spring Farm from the Camden area with 42.7 per cent, Oran Park with 39 per cent and Cecil Park with 38.3 per cent. These are also either in the North-West or South-West growth areas.