The Australian Housing Bubble
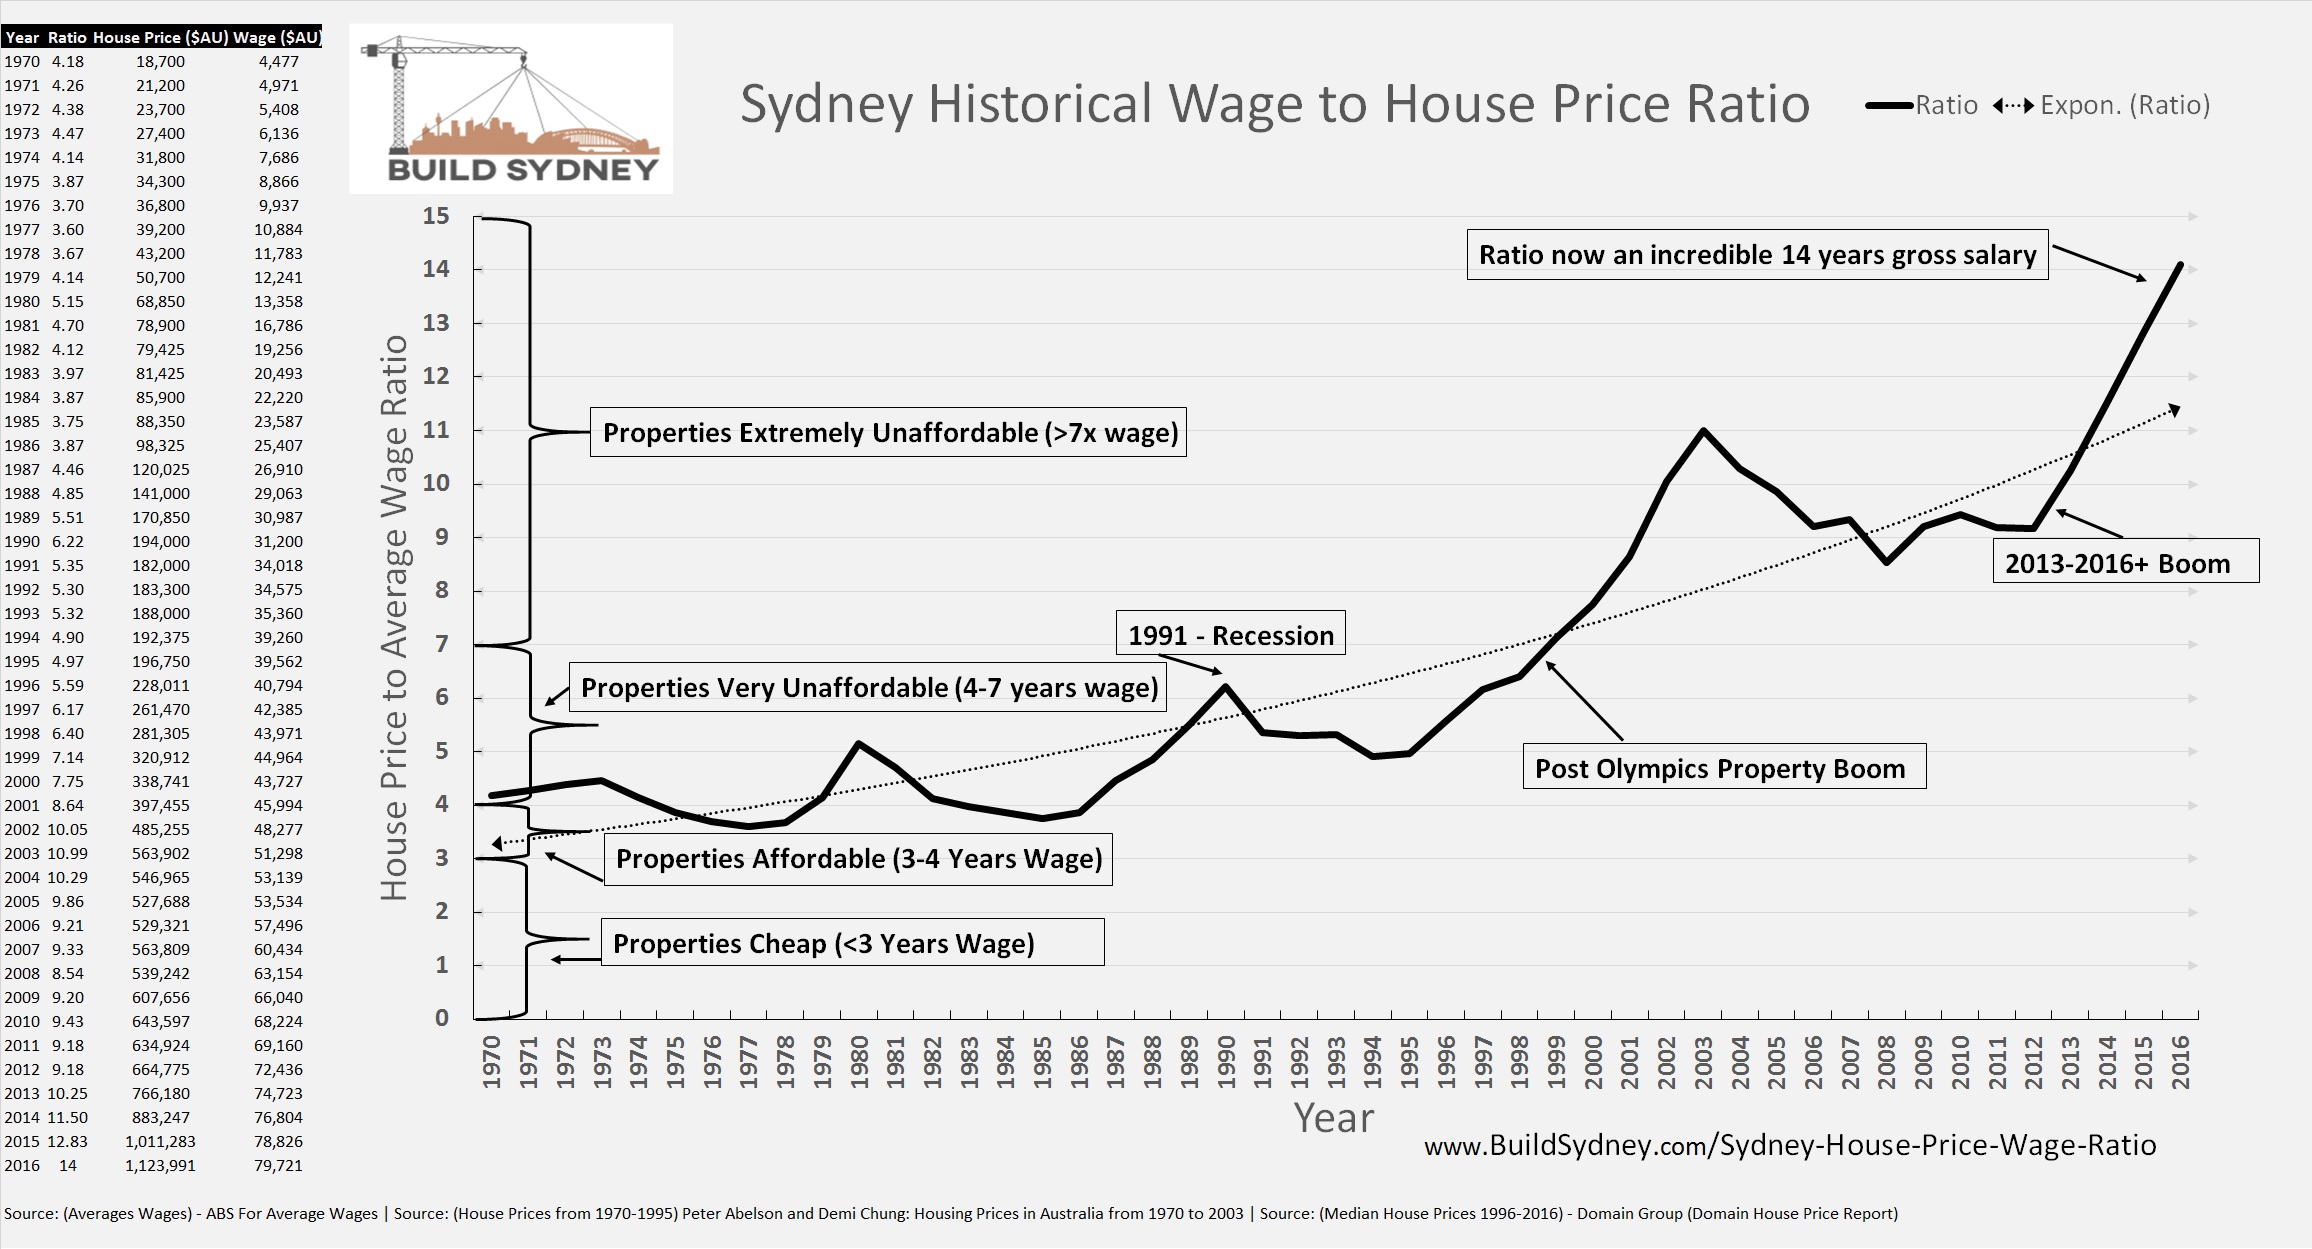
The hot topic right now is whether there is an Australian housing bubble or more specifically a Sydney housing bubble as median house prices have exceeded over $1 Million & the average person now needs to work 14 years before tax or 20 years after tax to purchase a house in Sydney.
This is caused quite the story in the media with almost every critic whether it be for there being a housing bubble or not. It is now a certainty that you will see a housing publication on the front page of the Sydney Morning Herald, The Australian & News.com.au on a daily basis. This clearly shows that the public is well aware of the issue at hand & is reading as well as engaging with the content.
This is why we decided to to a comprehensive write-up on the topic of the Australian & Sydney property bubble with the facts rather than just typical speculation you get in many thin, rushed articles you see online. The purpose of this resource is strictly for education purposes only.
Here is a graph showing Sydney House Prices to Average Wage Ratios from 1970-2016
The graph below shows just how out of control prices have become in Australia’s number 1 property hotspot destination, Sydney:
According to our findings based on several sources, Sydney’s median wage to income ratio is now at a spectacular 14 times the average wage. When you consider that this is before taxes & that with Australia’s progressive taxation system in place, it means homes in Sydney have never been more unaffordable as they are in the current market conditions.
This ratio is set to increase with Australia’s low expected incomes rises & further increases in the property market in the early part of 2017. First home buyers will need drastic legislation to stand a chance of buying a home in Sydney’s market.
Which Types of Property are most at risk?
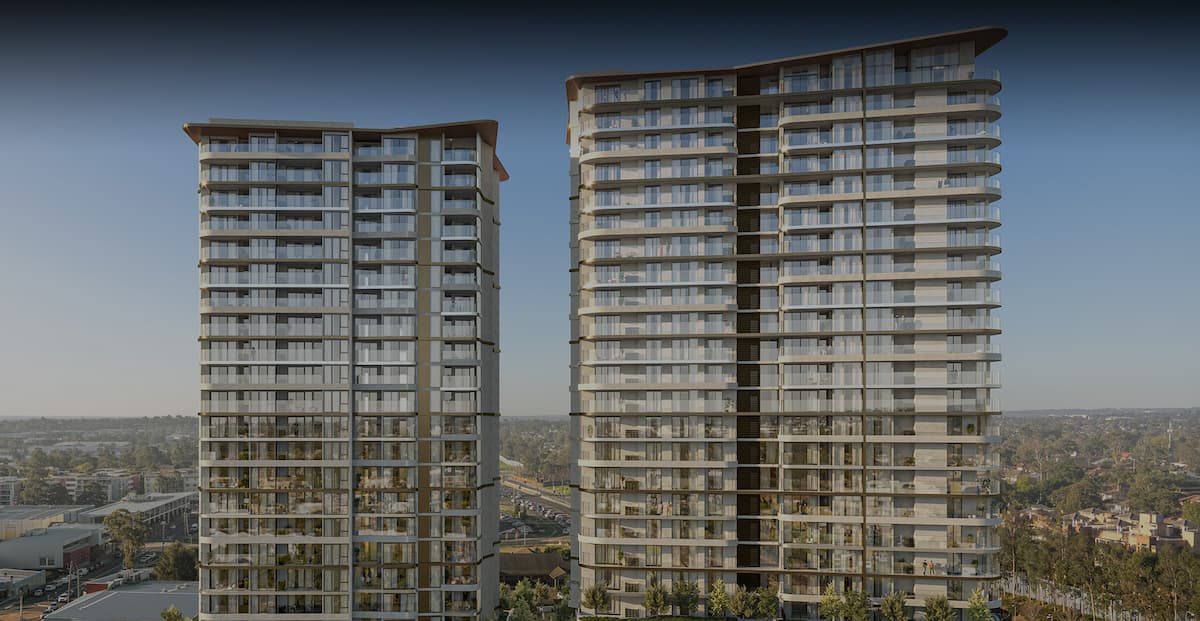
Housing stock which represents the greatest risk of a correction is high-density residential apartments in areas which are considered oversupplied.
An oversupplied area can be considered one that has excess stock in relation to the demand for that given suburb.
Some oversupplied areas as of April 2017 are Liverpool, Parramatta, Asquith, Homebush, Botany, Blacktown, & most suburbs along the North-West Rail Link which includes Castle Hill, Rouse Hill, Kellyville, Bella Vista & Norwest.
As of April 2017, there are 334 cranes on the skyline in Sydney according to RLB which represents an increase of 29 cranes or 9% from October 2016 figures in Sydney. This represents over 50% of the total 654 cranes currently on Australia’s skyline. Currently, there are also a total of 81 cranes over Brisbane, 30 over the Gold Coast & 146 cranes over Melbourne bringing the grand total on the eastern seaboard to 591 cranes which represent well over 80% of construction activity in Australia.
This represents over 50% of the total 654 cranes currently on Australia’s skyline. Currently, there are also a total of 81 cranes over Brisbane, 30 over the Gold Coast & 146 cranes over Melbourne bringing the grand total on the eastern seaboard to 591 cranes which represent well over 80% of construction activity in Australia.
The numbers show that minimal any construction activity (less than 20%) is occurring outside Australia’s Eastern seaboard which also signals there could be an overdevelopment in the Brisbane, Melbourne, the Gold Coast & Sydney markets. This is why it’s very important to see where exactly within each city is the development taking place (whether it’s concentrated in CBDs, spread out or in distant fringe locations).
Development Crane Heatmaps Around Australia
Brisbane Crane Development Heatmap

Gold Coast Crane Development Heatmap

Melbourne Crane Development Heatmap

Melbourne CBD Crane Development Heatmap

Sydney CBD Crane Development Heatmap

Sydney Crane Development Heatmap

As you can see from the heat maps above, it is quite clear that the development is quite spread out in the Sydney metropolitan area whereas the development is very concentrated in the Brisbane & Melbourne CBDs making these two markets more at risk of a housing correction as more stock will come onto the market in the same or adjacent suburbs.
This is why experts such as Pete Wargent suggest that the Sydney market is a lower risk when buying off-the-plan compared to the Brisbane, Gold Coast & Melbourne markets. However, you should always do your research on the developer when purchasing off-the-plan apartments.
Which Type of Housing is Relatively Safe from an excessive Correction?
Housing located on good sized blocks of land (normally over 300sqm), however, this varies depending on the distance to the CBD) & are relatively close to the CBD (approx 2-15km in the case of Sydney, 2-10km in the case of Melbourne & 2-7km in the case of Brisbane) with good public transport access, good quality roads, a solid local public/private school system & a university close by.
Factors Propping Up The Market
Overseas Student Population increases
Overseas student populations have exploded in our major cities of Brisbane, Melbourne & Sydney. This has created pressure on our road & rail infrastructure as students tend to have a high usage for both of these public resources.
Overseas Students from 1995-2017

Government Policies Favouring Property Investment
Capital Gains Tax Exemption & Discounts
There are two forms of discounts:
- A 100% exemption on the profits from resale of your family home (owner-occupier home), you can only have one of these listed to your name at any one time.
- A 50% tax discount on profits from investment properties. There is no limit to how many properties you can own & take a profit from.
These obviously give major incentives to people placing their money in a property over what would be seen as a more risky investment such as a business start-up.
Negative Gearing
Negative is the practice where an investor can purchase a property then rent it out & if the rent does not cover the cost of the mortgage repayments then they can claim the difference on their end-of-year tax return.
For example, a guy named Bob is earning $100,000 and buys an investment property for $1,000,000 and rents it out for $500 a week. His repayments on the property over a 30 year loan are $83,000 @ a 5% interest rate meaning that the total yearly rent he would be getting is $26,000 constituting a $77,000 loss which he could then claim against his tax and pay less personal income tax.
It is argued by the real estate industry that removing negative gearing will increase the cost of renting but this is yet to be seen and only speculation to what would occur can be discussed at this stage.
First Home Buyer Grants
These upfront grants are given by the government in certain states under certain conditions.
These policies have been criticised for pushing up the cost of housing, particularly when the Rudd government introduced these measures in 2009 right after the global financial crisis as these grants were leveraged to the tune of 80-90%.
This meant that a young couple with a deposit of $50,000 now had an extra $14,000 to leverage against so therefore instead of borrowing $250,000 they would instead borrow $320,000 meaning that extra $14,000 actually caused prices to go up by $70,000 over the short term.
Historically Low-Interest Rates
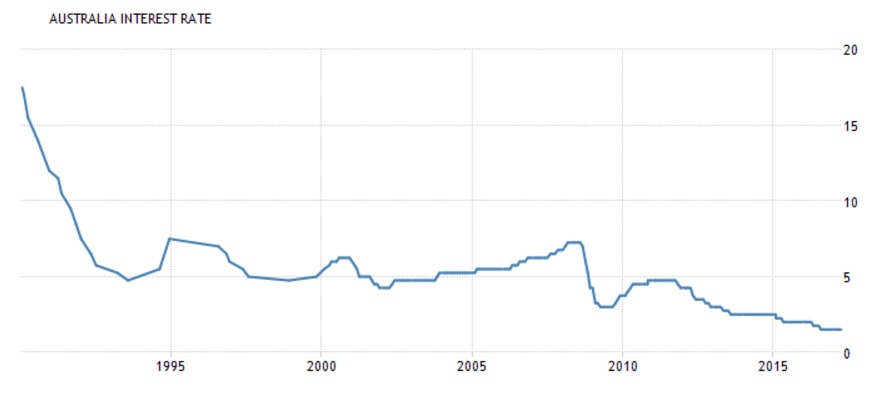
The current interest rates which are set by the RBA (Reserve Bank of Australia) are at a historical low of 1.5%. This is the lowest they have ever been. Even tho they are at the bottom, they could still fall a further 1.5% giving the RBA some room to move if things got really bad however the problem lies in Sydney’s economy booming with growth around 4% for 2016 but in contrast, Perth’s economy has been in recession and has contracted in 2016.
Here is a chart of the historical interest rates in Australia:
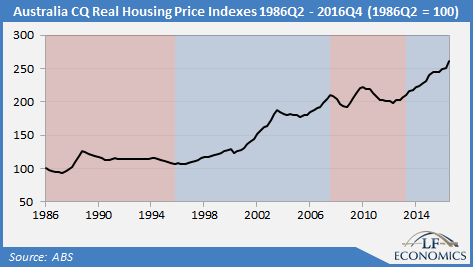
Sydney's Real house prices from 1986 to 2016
This graph above by LF Economics shows just how much Sydney house prices have grown in real terms. This growth far exceeds logic when you consider how much wages have grown over the same period making the growth completely unsustainable.
Here are some related articles on the subject of the Sydney Property Bubble:
- Sydney Housing Ratio 14 Times Annual Pre-Tax Salary
- The Sydney Boom Continues Median of $1.4 Million
- Sydney House Prices Grew 5x Faster than Wages in 2016
- Sydney CBD Apartment Prices Double the Melbourne CBD
- When will the Australian Housing Bubble Burst?
- Is Population Growth Causing A Property Bubble
- Signs A Property bubble exists within Sydney
- Could Automation cause a Housing Crash in Sydney?


